In today’s dynamic corporate landscape, workplace safety remains paramount for organizations across industries. While traditional approaches relying on lagging and leading indicators, safety incidents and accident information have long been the cornerstone of safety programs, there’s a growing recognition of their limitations in anticipating and preventing accidents.
Enter predictive modeling and machine learning, which offer a paradigm shift in safety management by leveraging diverse data sources for intelligent insights and proactive risk mitigation strategies.
Historically, safety management has heavily relied on lagging indicators, which react to incidents post-occurrence, and leading indicators, which attempt to predict future incidents based on proactive measures.
However, these methods often fall short in providing precise predictive capabilities and proactive risk management strategies.
Predictive modeling and machine learning, on the other hand, revolutionize safety management by harnessing various data sources beyond traditional incident records.
By integrating environmental factors, equipment performance data, worker behavior analytics, and external influences like weather patterns or regulatory updates, these advanced techniques offer a more holistic view of potential risk factors and enable accurate predictions.
Here are just five types of data and insights that come to mind that predictive modeling and machine learning can track to shape and influence decisions.
- Historical Incident Data: By analyzing past incidents, predictive models can identify patterns and root causes, helping prioritize risk mitigation efforts and forecast the likelihood of future incidents.
- Environmental Factors: Monitoring weather patterns, temperature and air quality allows machine learning algorithms to correlate environmental data with safety incidents, identifying high-risk conditions and optimizing safety protocols.
- Equipment Performance Data: Tracking machinery performance and maintenance history enables predictive maintenance models to forecast equipment failures, reducing downtime and preventing safety hazards.
- Worker Behavior Analytics: Analyzing employee behavior and near-miss reporting helps identify behavioral patterns indicative of increased risk. Machine learning algorithms can recommend targeted interventions such as additional training or supervision.
- External Data Sources: Incorporating regulatory updates, industry benchmarks, and socioeconomic trends allows predictive models to assess their impact on safety performance and recommend adaptive strategies for compliance and risk mitigation.
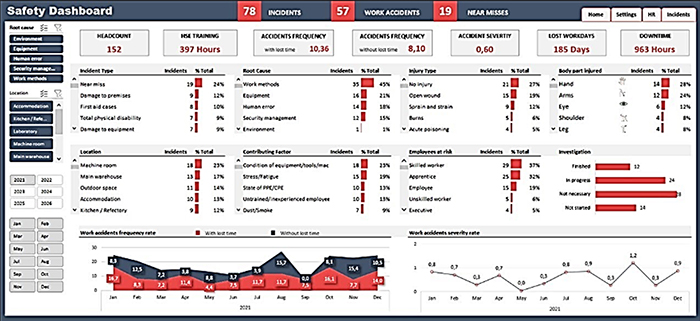
Charts and graphs serve as indispensable aids for conveying intricate data and deriving practical insights efficiently.
Within the realm of safety management, predictive modeling and machine learning facilitate the visualization of diverse data categories. These visual representations aid in the examination of incident patterns and the comprehension of causality.
Furthermore, monitoring and reporting serious injury and fatality potential (referred to as “SIF” and “SIFp”), evaluating equipment efficiency, observing worker conduct and assessing the effectiveness of predictive models via dashboards constitute a commendable initial approach. Your organization can enhance its grasp of safety metrics and preemptively address risks through precise visualization.
As a safety leader, you possess the ability to convey crucial messages and facilitate comprehension of necessary solutions by employing data storytelling and strategic information design using the following graphics:
- Incident Trend Analysis: A line chart can be used to track the trend of safety incidents over time, highlighting any fluctuations or patterns. This can help identify seasonal variations, emerging trends or areas of concern that require further investigation or intervention.
- Root Cause Analysis: A pie chart or bar graph can visualize the distribution of root causes contributing to safety incidents. By categorizing incidents based on their underlying causes, organizations can prioritize corrective actions and allocate resources more effectively to address the most prevalent issues.
- Near-Miss Reporting: A bar graph or stacked column chart can depict the frequency and type of near-miss incidents reported within a specified time frame. This visualization helps organizations understand the proximity of potential hazards and allows them to implement proactive measures to prevent similar incidents from escalating into accidents.
- Equipment Performance: Using line charts or scatter plots, organizations can track the performance metrics of equipment, such as downtime, maintenance intervals and failure rates. Visualizing this data enables proactive maintenance scheduling and optimization of asset utilization to minimize the safety risks associated with equipment failures.
- Worker Behavior Analysis: A histogram or box plot can illustrate the distribution of behavioral metrics, such as compliance with safety protocols or participation in training programs. By identifying outliers or trends in worker behavior, organizations can tailor interventions — such as targeted training initiatives or reinforcement strategies — to improve overall safety culture.
- Environmental Monitoring: Line graphs or area charts can visualize environmental factors such as temperature, humidity or air quality over time. Overlaying this data with safety incident trends allows organizations to assess correlations between environmental conditions and incident rates, enabling them to make proactive adjustments to safety protocols based on weather patterns or environmental forecasts.
The integration of predictive modeling and machine learning into safety management practices represents a transformative shift toward proactive risk mitigation and data-driven decision making.
By harnessing diverse data sources and leveraging advanced analytical techniques, organizations can enhance safety protocols, optimize operations and elevate overall performance.
The ability of predictive techniques to provide proactive risk identification is invaluable in preventing accidents before they occur, fostering a culture of prevention rather than reaction.
Moreover, the automation of data analysis and visualization through charts and graphs enables stakeholders to comprehend complex information effectively and derive actionable insights, from incident trends to equipment performance and worker behavior.
These innovative approaches are shaping the future of safety management, setting a new standard for proactive risk mitigation and organizational resilience. &
The post Predictive Modeling: The Future of Workplace Safety Management appeared first on Risk & Insurance.


